

Mini-App · Sales
Square sales report: top items and busiest hours
For cafes, shops and food trucks that sell through Square and want to know what sells and when it sells. Upload the Item Sales CSV you export from your Square Dashboard.
You get your top items by Net Sales, with quantity and share of total. You also get Net Sales, quantity and transaction counts for each hour of the day, plus a chart that marks your peak hour.
- 1Choose the fileNot chosen yet
- 2Check the values1 value you can change
- 3Run and get the resultFree
1Square item sales export
No file yet · needs Time, Item, Qty, Net Sales, Transaction ID
2Values you can change
Runs the app’s saved steps, no AI. A file missing a column is not run or charged.
3Result
Choose your file and press Run — the result shows here, like the sample below.
What it makes, on a sample file
Table 1 sums Net Sales and Qty per Item, keeps the top 10 by Net Sales, and adds a total row covering all items (shares are of the overall Net Sales). Table 2 reads the clock time from 'Time', groups by hour (only hours with data), and counts distinct Transaction IDs. 0 row(s) had an unparseable Time and were excluded from the hourly table (they remain in the item table).
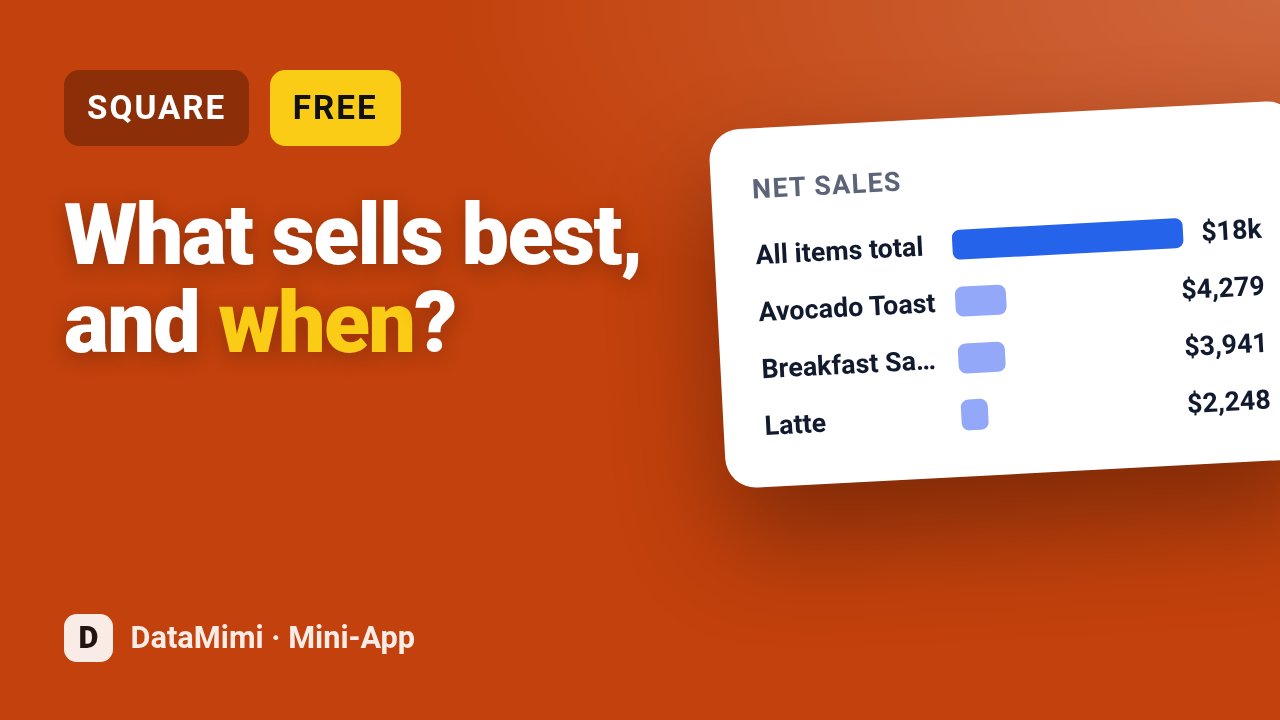
- All items total$17,612
- Avocado Toast$4,279
- Breakfast Sandwich$3,941
- Latte$2,248
- Cold Brew$2,127
- Blueberry Muffin$1,726
- Croissant$1,660
- Americano$1,630
| Item | Net Sales | Qty | Share of total Net Sales (%) |
|---|---|---|---|
| Avocado Toast | 4,279.17 | 441 | 24.3 |
| Breakfast Sandwich | 3,941.45 | 469 | 22.4 |
| Latte | 2,247.93 | 432 | 12.8 |
| Cold Brew | 2,126.9 | 451 | 12.1 |
| Blueberry Muffin | 1,726.2 | 497 | 9.8 |
| Croissant | 1,660.47 | 424 | 9.4 |
| Americano | 1,630.02 | 416 | 9.3 |
| All items total | 17,612.14 | 3,130 | 100 |
What your file needs
Square item sales export, one row per record, with these columns (named differently is fine — the app asks which column is which):
TimeItemQtyNet SalesTransaction IDHow to use it
- 1In Square Dashboard, go to Reports > Item Sales, pick your date range and export the detailed CSV. It needs the columns Time, Item, Qty, Net Sales and Transaction ID.
- 2Check that the Time column has clock times and that Net Sales is filled in. Rows with a missing or unreadable time still count in the item table but are left out of the hourly table.
- 3Set how many top items you want listed. This changes only the item table, not the hourly figures.
- 4Read the first table for your leading items, each with its share of all Net Sales. The last row is the total for every item. Then use the hourly table and chart to find your busiest hours.
Common questions
Which Square file do I need, and what columns must it have?
In Square Dashboard, go to Reports > Item Sales, pick your date range and export the detailed CSV. It needs the columns Time, Item, Qty, Net Sales and Transaction ID.
What if a column in my file is named differently?
The tool looks for Time, Item, Qty, Net Sales and Transaction ID. If your export uses other names, rename those headers in the CSV to match before you upload. Make sure Time holds clock times and Net Sales is filled in.
What happens to rows with a missing or odd time?
Those rows still count in the top items table and its total. They are left out of the hourly table and chart, so the hourly figures may add up to a little less than the item total.
Is my sales data kept private, and what does it cost?
Your file is used only to build this report. Each run costs 1 credit. Changing how many top items are listed only affects the item table, not the hourly figures.