

Mini-App · Advertising
Facebook (Meta) Ads cost per result for every campaign
For small business owners and marketers running Facebook and Instagram ads who want to see which campaigns are worth the money. Upload the daily campaign CSV you export from Meta Ads Manager.
You get one row per campaign plus a TOTAL row with spend, results, cost per result and CTR. Campaigns above your cost limit, or with spend but no results, are flagged, with a bar chart.
- 1Choose the fileNot chosen yet
- 2Check the values1 value you can change
- 3Run and get the resultFree
1Meta Ads daily campaign export
No file yet · needs Campaign name, Day, Impressions, Amount spent (USD), Link clicks, CTR (link click-through rate), Results, Result indicator
2Values you can change
Runs the app’s saved steps, no AI. A file missing a column is not run or charged.
3Result
Choose your file and press Run — the result shows here, like the sample below.
What it makes, on a sample file
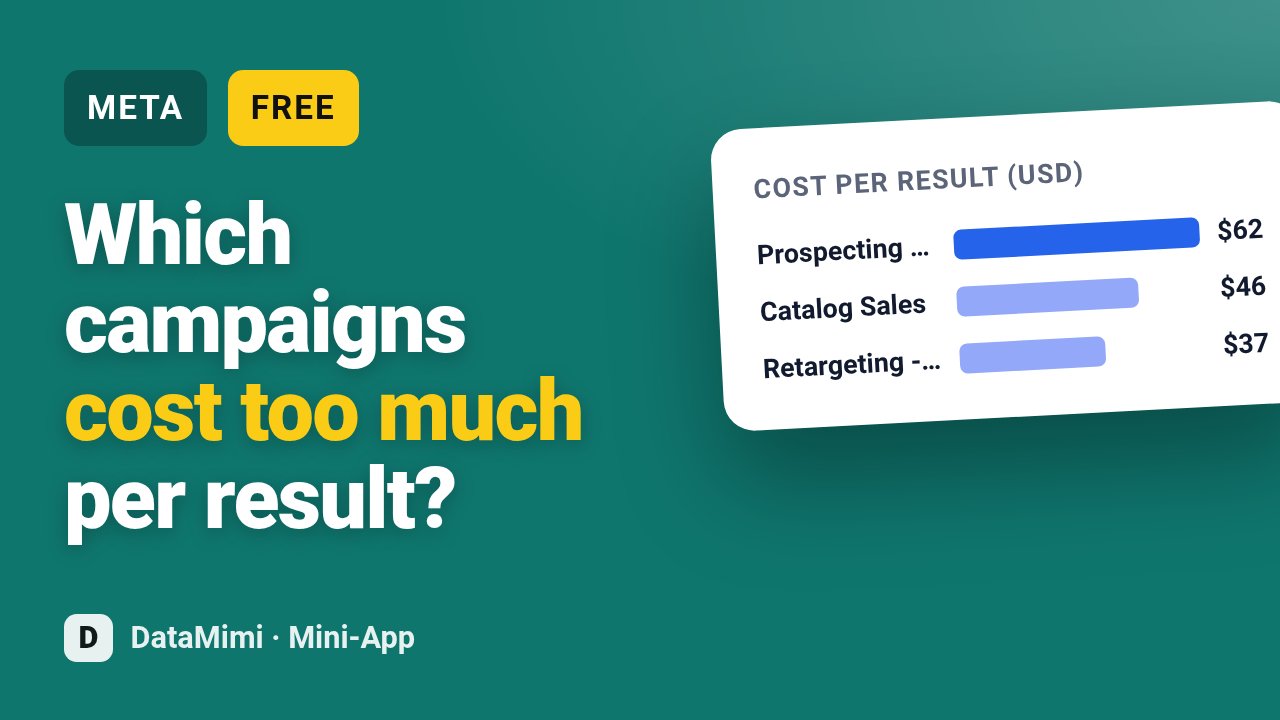
Grouped 1278 daily rows by campaign for 2025-07-01 to 2026-08-30: 3 campaigns, 2 flagged (cost per result above 40 USD, or spend with no results; 0 with no results shown as blank cost per result and not drawn on the chart). Blank Results counted as 0; cost per result = total spend / results; average CTR is pooled (clicks / impressions); mean daily CTR is the simple average of the daily CTR column. TOTAL row uses overall sums.
- Prospecting - Lookalike$62
- Catalog Sales$46
- Retargeting - 30d$37
| Campaign name | Days | Total Amount spent (USD) | Impressions | Link clicks | Results | Cost per result (USD) | Average CTR (%) | Mean daily CTR (%) | Result indicator | Above threshold |
|---|---|---|---|---|---|---|---|---|---|---|
| Prospecting - Lookalike | 426 | 36,351.92 | 2,047,527 | 22,525 | 588 | 61.82 | 1.1 | 1.1 | actions:offsite_conversion.fb_pixel_purchase | Yes |
| Catalog Sales | 426 | 28,488.01 | 1,809,119 | 23,521 | 621 | 45.87 | 1.3 | 1.3 | actions:offsite_conversion.fb_pixel_purchase | Yes |
| Retargeting - 30d | 426 | 18,135.45 | 1,107,753 | 19,943 | 495 | 36.64 | 1.8 | 1.8 | actions:offsite_conversion.fb_pixel_purchase | No |
| TOTAL | 1,278 | 82,975.38 | 4,964,399 | 65,989 | 1,704 | 48.69 | 1.33 | 1.4 | actions:offsite_conversion.fb_pixel_purchase | Yes |
What your file needs
Meta Ads daily campaign export, one row per record, with these columns (named differently is fine — the app asks which column is which):
Campaign nameDayImpressionsAmount spent (USD)Link clicksCTR (link click-through rate)ResultsResult indicatorHow to use it
- 1In Meta Ads Manager, export the campaign report broken down by day as CSV, with Amount spent, Impressions, Link clicks, CTR (link), Results and Result indicator columns.
- 2Check that the export covers the date range you want and that spend is in USD.
- 3Set the maximum cost per result you accept. Campaigns above it are flagged, and so are campaigns that spent money but got no results.
- 4Read the table from most expensive to cheapest cost per result, then check the 'Above threshold' column and the TOTAL row at the bottom.
Common questions
What file do I need to export from Meta Ads Manager?
Export your campaign report broken down by day as a CSV file. It needs Campaign name, Day, Impressions, Amount spent (USD), Link clicks, CTR (link click-through rate), Results and Result indicator columns.
What if my columns are named a little differently?
Meta sometimes changes column labels or adds the currency to the name. If a column is named differently, match it to the expected field when you upload, and make sure spend is in USD so the cost per result is correct.
How does the flag work?
You set the highest cost per result you are willing to pay, for example $40. Any campaign above that is marked in the 'Above threshold' column. Campaigns that spent money but got zero results are flagged too.
Is my ad data kept private, and what does it cost?
Your file is used only to build your report and is not shared. Each run costs 1 credit.